Bojan Vukasinovic home page
The resulting spray of small droplets is characterized using high-speed imaging and particle-tracking techniques. The results show that the average spatial and velocity distributions of the spray droplets are fairly axisymmetric during all stages of the atomization. The mean diameter of the droplets depends on the forcing frequency to the –2/3 power. The ejection velocity of the spray droplets depends on both the magnitude and the rate of change of the forcing amplitude. Thus, controlling the characteristics of the forcing signal may lead to strategies for controlling the spray process in specific applications.
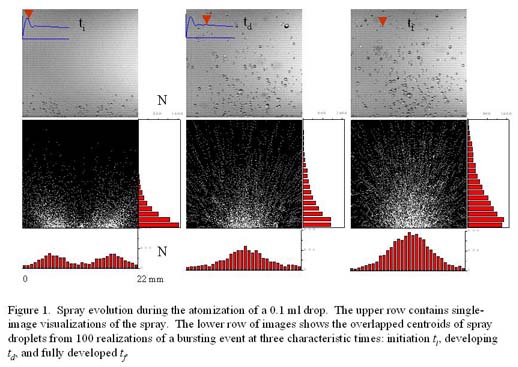
Figure 1 shows the spatial evolution of the spray droplets during the bursting of a 0.1 ml water drop at the standard forcing frequency (970 Hz nominal) and a peak transient acceleration of 550 g. The droplet images were taken at three instants in time; start-up ti, developing td, and fully developed tf. The top row contains single images of the spray illuminated by a point light source. The inset plot on these images is the amplitude response of the drop–diaphragm system and it marks the time at which the image was captured. Each image in the bottom row is an overlay of the centroids of detected spray droplets in a central plane obtained from 100 bursting event realizations taken at the same time delay relative to the onset of the step-forcing signal. These images show that the spray is reasonably symmetric within the imaging plane during all stages of the atomization. The radial distribution of the number of droplets has an initial peak located near the position of the contact line of the primary drop. As the bursting process proceeds, this peak moves over to the centerline and remains there until the primary drop is drained.
The high-speed images of the spray enable measurements of the projected cross sectional area of the droplets and an assessment of their mean diameter. Depending on the driving frequency, the image resolution is adaptively increased along with the frequency.
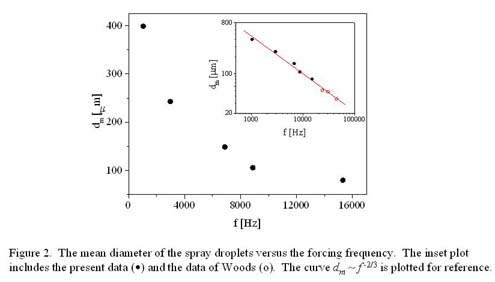
The dependence of the mean diameter of the spray droplets dm on the forcing frequency exhibits a power-law relation as shown in Figure 2. Also included in the figure are the complementary high-frequency results of Woods (1994) who atomized a film of water by vibration of a cantilevered beam. Faraday-wave or ultrasonic atomization of a liquid produces droplets with a mean diameter related to the capillary wavelength at the forcing frequency. The capillary wave dispersion relation shows that the capillary wavenumber depends on frequency like f 2/3, and so the mean droplet diameter should vary with frequency like f -2/3. This is verified in Figure 2, which shows a least squares, power-law data fit with an exponent of –0.667. These results also show that the formation of spray droplets less than 30 mm requires forcing frequencies higher than 60 kHz; a formidable task. For example, Woods (1994) claimed to produce 10 mm droplets using an atomization frequency of 200 kHz.
The four-frame, forward-backward, particle-tracking algorithm was used to determine the spray droplet velocity distribution during a VIDA bursting event. Typically, there were enough data in the 300 sampled images for the particle-tracking algorithm to generate between 1,000 and 1,500 velocity vectors in the measurement plane.
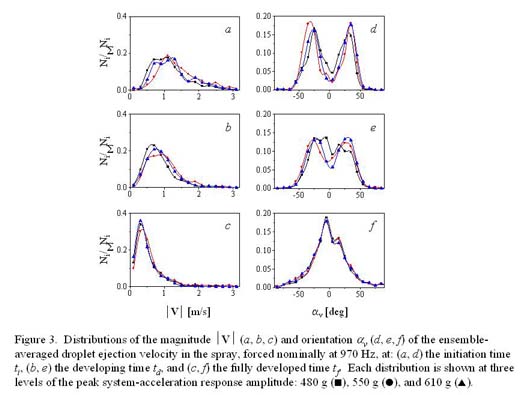
Statistical distributions of the ensemble-averaged droplet ejection velocity are given in Figure 3 for a standard forcing frequency of 970 Hz and three different forcing amplitudes. This measurement is reported as the velocity magnitude and orientation of the ejected droplets in a horizontal 2 mm band just above the drop. Figures 3a and d correspond to the initiation time of atomization ti, Figures 3b and e to the developing time td, and Figures 3c and f to the fully developed time tf. Each distribution is plotted for the three different forcing amplitudes. At the initiation time, the droplet ejection velocity had a very broad distribution between 0 and 3 m/s with about 20% of the droplets having the peak velocity of 1.1 m/s. This broad range was the result of a highly disordered free surface shape on the primary drop. As the bursting process evolved, the magnitude of the ejection velocity decreased and its distribution narrowed. At the fully developed time tf, about 34% of the droplets had the peak velocity of 0.3 m/s. The distribution of the angle of ejection of the spray droplets (measured relative to the vertical with the positive direction taken to be clockwise) shows two steep peaks between the angles of ±35–40° at the initiation time of atomization ti (Figure 3d). Later in the bursting process, Figure 3f shows that the double peak has evolved into a single peak indicating that most spray droplets were ejected vertically upward. The angular distributions of the ejected droplets agree with the earlier data on the spatial distributions of spray droplets in Figure 1.
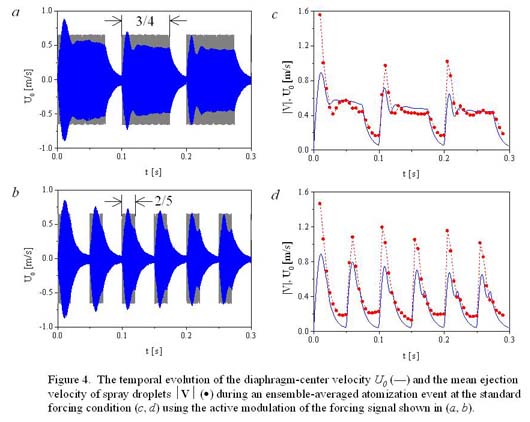
The effect of a square-wave amplitude modulation of the forcing signal is shown in Figure 4 for the case of standard drop forcing. When the duty cycle was 75% (Figure 4a) the diaphragm response included “quasi-steady” segments. These quasi-steady segments were absent when the modulation frequency was increased and the duty cycle set to 40% (Figure 4b). The corresponding ensemble-averaged droplet ejection velocity and the amplitude of the diaphragm-center velocity versus time are shown in Figures 14c–d. In the second case, the diaphragm motion was composed of a sequence of transient responses and so the droplet ejection velocity exceeded the diaphragm-center velocity throughout most of the forcing period. This dependence of the droplet ejection velocity on the shape of the forcing signal is attractive for the active control of spraying.
REFERENCES
back to VIDA